Latest Entries »

If you base the December climate report on the last two weeks, you get a completely different picture than when you look at the entire month for the Youngstown area. Remember when our high was in the low 60s??? Yeah, that was December.

From December 1st through the 20th, Youngstown only saw one day with temperatures below normal. Since December 21st, we’ve seen four, and five days were with temperatures at or one degree above normal. In the first 20 days of December, 10 days saw temperatures at least 10 degrees above normal. When we average all the temperatures up for the month, Youngstown’s mean December temperature was 36.3 degrees, 6 degrees above normal. This also made it the 6th warmest December in Youngstown history.

In terms of snow, that was another tale of two completely different stories. The first 20 days of the month, only 0.3″ of snow fell. However, with two big snow events since Winter began, from the 21st through the 31st, we saw 24 inches of snow. The 24.3″ total December snowfall puts this December as the 3rd snowiest December on record for Youngstown. That total was also 9.3 inches above normal.

As we sit here on new year’s eve, about ready to usher in another year – I wanted to look back on the weather events of the year for the Mahoning Valley. The only problem is, there’s not much to talk about.

2012 was a relatively quiet weather year across the area. Until last week’s snow storm, the highest 24 hour snow total was from January, where we saw 4.8 inches of snow in a 24 hour period. The winter of 2012, which “technically” began in December 2011, was the sixth warmest winter on record for the Youngstown area.

Speaking of “warm,” March broke the all time record in Youngstown for the warmest March ever. The average March temperature (taken from every high added to every low and dividing by 2) was 49.5 degrees. This was 12.8 degrees warmer than the average of 34.6 for March. This broke the record of 48.1 degrees, previously set in March of 1946.

The warmth continued much of the summer, as May also recorded a record number. May of 2012 was the third warmest May in Youngstown, where the average temperature was 64.5, 6.7 degrees above the normal average of 57.8 degrees.

It was definitely a hot summer, and we had 18 days with highs over 90 degrees in 2012. The month of May featured 2 days with highs above 90 degrees, June had 4, and July had 9 days. We even had 3 days over 90 in August.  The average number of days with highs above 90 in Youngstown is 7.

Also a highlight of the summer was the EF-0 tornado which touched down in Girard on August 5th.

We had a few severe weather days as well across the region, but nothing compared to that which was Superstorm Sandy. We obviously know the serious impacts Sandy had on the east coast. We felt a few of the effects in Youngstown, and thanks to Sandy, October became the third wettest in Youngstown history.

December has already featured more major snow events than last winter, thanks to the 10 inches of snow we saw last week.

As we kick off 2013 tomorrow, no one knows what it will bring. You can bet that YoungstownWX HQ will be here for all your Mahoning Valley weather information. Thanks for all our loyal readers and we hope to always continue to improve our service to the area!

Next Round of Snow Saturday

The next round of winter weather is on its way to the Mahoning Valley and will affect the first half of our weekend. Another area of low pressure is currently moving up from the south towards the Ohio Valley and will cause snow to overspread the region overnight into Saturday morning.

We can expect an inch or so around daybreak, and should see a total of 2 or 3 inches by the time the snow ends in early afternoon. As cold air moves over the lake behind the storm system, the lake effect snow will kick in. Places in the snow belt may see 4-7″ of snow by Monday morning, but in general all final storm totals will be less than 3 to 4 inches across the region. It won’t be like Wednesday, but definitely want to take it easy if you’re heading out Saturday. The majority of the snow will be over by 1-2 pm with light flurries afterwards.

An extremely dynamic storm system continues to crank up this Tuesday morning in the Southern Plains, and confidence is increasing it will play a major role in our local weather beginning Wednesday and lasting through Thursday morning.

Capture

Above is the latest water vapor image of the storm now beginning to cause severe weather and tornadoes in the southeast. Yes, this is the same storm that will bring blizzard conditions to the lower Ohio Valley and the snow to us locally. Water vapor images capture the amounts of moisture in the air. You can see it is already beginning to load up on moisture, and the area of deepest moisture will continue to advance in our direction today.

The snow should begin Wednesday morning, and really ramp up in the afternoon and evening, before diminishing overnight into Thursday morning. With the future track of the low coming into better agreement now just south of the Ohio River, the Mahoning Valley would be under the gun for high snowfall accumulations. As the storm deepens (or strengthens) the gradient between it and the high pressure to our west, will create windy conditions as well later Wednesday. This would cause blowing and drifting snow, making travel even more difficult.

A general 7-12 inches of snow is possible for the areas, especially east of Akron-Canton. Places as far south as Pittsburgh can still be under the gun for 5-7″ of snow, if the current track holds. With the large amounts of moisture expected to be in place, the snow will be wet and heavy.

The threat for mixed precipitation is much less today, and this should remain an all-snow event for the entire Mahoning Valley. However, these systems can take in dry air – and if this happens, the snow totals would be a little lower. But as of right now, there is no reason to believe this will happen.

As the storm unfolds Wednesday, keep it here for the latest information.

As of 9am 12-25, the following watches and warnings are in effect:

A winter storm WARNING is in effect for all of NE Ohio from 7am Wednesday through 7am Thursday.

A winter storm WARNING is in effect for Columbiana (OH), Mercer & Lawrence counties (PA) from 7am Wednesday through 6am Thursday.

A winter storm WATCH remains in effect for SW Pennsylvania including the city of Pittsburgh.

—————————————————————————————————————————————————–

You can follow Craig on Twitter … His account is @ytownwx

Post-Christmas Storm Taking Shape

First things first: Christmas will be a dry day. I’m going with more clouds than sun, but dry for all of the area on Tuesday. High temperatures will be in the mid 30s. Beginning Tuesday night and through Thursday is when the real fun begins.

500mb 12-24-12

Above is the current 500 millibar analysis chart. This is essentially what is going on about halfway up in the vertical profile of earth’s atmosphere. I circled a dip on the map, which is the energy that will eject into the southern Plains tomorrow and move through the Mid Atlantic states on Wednesday into the northeast by the weekend. It will also be responsible for a severe weather and tornado outbreak on Christmas for the southeastern United States.

The path the storm takes over the next day or so will influence a lot of what happens in the Mahoning Valley. Currently, it appears the system I have circled will move towards the Ohio Valley and stay the south of our area. It will then spawn another low that will move up the east coast. All three reliable computer models are now suggesting this will happen. This will put the area in an area of potentially significant snow. Currently, we can see anywhere from 6 to 12 inches of snow.

The path really can affect snow totals though, and there are still a few questions. If the storm sneaks a little farther north, the line dividing the snow with the mixed precipitation will also shift to the north. Also, the potential does exist (since we don’t have a true Arctic air mass in place, we might see some warm air mix in at some point during the storm. This could also affect snowfall accumulations.

Since it is still a little far out, I don’t want to speculate any more than this for now. Simply stay tuned to the latest forecasts, and know if you have to travel Wednesday you may want to alter travel plans. The timing of the heaviest snow would be late morning Wednesday through Thursday morning.

A winter storm watch has been issued for all of Northeastern OH from Wednesday morning through Thursday morning.

——————————————————————————————————————————————————

You can find Craig on Twitter! He is found @ytownwx

To Christmas…… and Beyond

This Christmas will be all work for many meteorologists as we’ll be watching 2 storm systems over the next 3 days. Since I’m sure you are all spending time with family and friends, I’m going to keep this very brief tonight.

First thing’s first: Christmas eve. There will be some light precip throughout the afternoon. We will have some light rain scattered through the region, but not an all day wash out by far. As cold air works its way in through the evening, we will see some snow mix in. I think we’ll stay away from the freezing rain but use extra caution while out and about after dark Monday night.

Christmas day will be the calm before the big wallop on Wednesday. We should see temperatures in the middle 30s with more clouds than sun, but it will stay dry.

Wednesday has a lot more questions than answers right now. The storm system that has moved into the west tonight will eject into the Plains on Monday and work up into the lower Ohio valley Tuesday into Wednesday. The exact track is obviously still in question a few days out – and that will have major implications on the forecast. As it is now, we will most likely stay in the cold sector of the storm, staying all snow. If this happens we can be looking at a decent accumulation. Locations farther south of where the storm system tracks will have a mix of snow and rain and/or all rain.

Monday will be tolerable, so keep up with the latest forecasts for Wednesday – especially if you will be traveling. I’ll try to get another post up tomorrow afternoon and again sometime Christmas day.

Up and Down November Ends Below Average

The months during “transition seasons” of Spring and Fall often contain wacky, rapidly changing weather. November 2012 was no different for the Youngstown area.

HighsGraphYNG

This graph shows the high temperatures for every day in the month of November at the Youngstown Airport.

If we take all those numbers in the chart above and average them, our average high in November was 47.3 degrees. Our average low was 29.8, putting our mean November temperature at 38.6. This is 2.8 degrees below the average November mean temperature. However, as the graph shows, November was characterized by a few days of extreme warmth and also extreme cold.

This is typical of the fall season, as the summer air doesn’t yet want to give into the winter cold that tries to make its presence felt. These temperature battles are often what drives the storm systems that move through the region.

Notice the two major temperature swings in the month. The first around the 12-13th and the second from the 24-25. These correspond to the two major storm systems that brought the bulk of our monthly precipitation. These four days account for 0.52″ of the 0.82″ of rain we saw in the month. That 0.82″ is 2.36″ below the normal precipitation for November.

With the sudden change in temperatures, came the season’s first measurable snowfall to the area too. However, in this department we were also below normal. Our 2.9″ of total snow accumulation was 0.7″ below the normal for the month. 1.5″ of that came as lake effect snow on the 24th.

Temperature, rain, and snow were all below normal in November. With the beginning of December having above average temperatures, we’ll see what roller coaster they might take this month. Our average high on December 1 is 42, and drops to 33 by December 30. Normal snowfall for December is 14.1″ so we’ll see what happens this month. One thing for certain, YoungstownWX HQ will be here to keep you updated!

_____________________________________________________________________________________________

All of the above numbers are reported from, and averages of the Youngstown-Warren Regional airport.

You can follow Craig on Twitter! His account is @ytownwx  

Superstorm Sandy might be long gone on the upper air and surface charts, but her residual effects will last much longer. The last thing the people of the northeast need is another large storm to affect relief efforts.

Unfortunately, they’ll get that “last thing they need” in the form of a true nor’Easter.

Fortunately, for us here in northeast Ohio (and also for those of you who read this from west PA), this system won’t bring along the gloomy skies that Sandy brought us all last week. The track of the low will be in a similar location to Sandy, but it will parallel the coast and not make its way inland towards us.

06 Z 500mb GFS analysis 6 Nov 2012

Here’s a look at this morning’s 500 millibar analysis chart. You’re looking at the state of the atmosphere about halfway up. Notice I circled two pieces of energy (shown by the oranges and the “X”). Both of these pieces will come together to form the coastal low. Notice, however, the flow of the black lines (isobars, or lines of equal pressure). The two pieces of energy will basically follow these lines, thus revolving AROUND our location, and not through it. We actually will see nice weather the next few days. However, with that dip in place, cold air will continue to be funneled into our area from Canada.

I don’t know about you, but I’ll take below average temperatures with the sun, than anything else the northeast will have to deal with.

That Yellow Thing Returns

Obviously the Mahoning Valley isn’t dealing with what has been happening on the east coast, but we sure had our fair share of ugly weather last week. So, seeing this week’s forecast should “brighten” you up – no pun intended.

For Monday, though, we’ll remain under a pesky northerly flow off the lake. This will keep the clouds and colder than normal temperatures with us another day. We’ll be in the low 40s today.

Tuesday should be a decent say as you get out and vote. Temperatures will remain below average, BUT the clouds should mix with the sun. Yes, I said the sun. We do know what that is, right? We’ll see temperatures in the mid 40s Tuesday.

By this weekend, it continues to look phenomenal as winds begin to come out of the south and warm air advection works its way into the area. We could be talking 60 by next Sunday if current forecasts hold.

For those of you who have heard about the next coastal storm to affect the northeast, it is true. However, it is nothing like Sandy, and we won’t feel any outer effects.

By now we’ve seen the destruction left in the wake of Hurricane Sandy. The pictures don’t do enough justice to the pain and suffering that parts of the northeast have endured. Residents of New Jersey and New York have begun the seemingly improbable task of assessing the damage and cleaning up after one of, if not the most, devastating storms to hit this area of the country. Tempers have begun to flare over relief aid, the NYC Marathon, and other social and economical impacts following the storm.

One thing is certain: preventing tropical cyclones and these “superstorms” is all but impossible. We can’t drop a magic substance in the water to make the storm disappear, or change course. What we can do, however, is try to produce as accurate of a forecast as possible to warn residents of any impending danger.

As North Carolina meteorologist Tim Buckley pointed out in his reaction to the storm, “the forecast for Hurricane Sandy was nearly flawless.” The Monday before landfall (7 days) one computer model, the European forecast model, predicted a large storm impacting the northeast. While only one model, it was worth noting. As the week went on, all the models began to converge on the same catastrophic scenario – a large, “hybrid” storm would most likely cause a lot of problems somewhere in New England or the Mid Atlantic. (Don’t forget that word, “hybrid,” we’ll get back to that in a second).

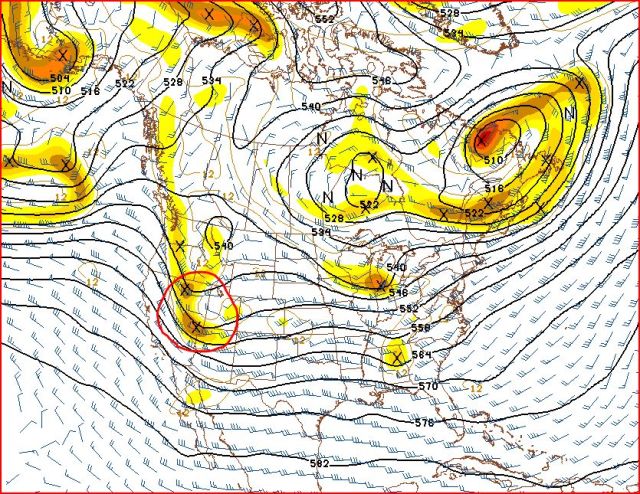
Needless to say, the final result was indeed awful. Sandy met up with a blocking pattern in the Atlantic, not allowing her to move out to sea like so many other storms have in history. A very large trough was digging through the eastern US accompanied by a large cold air mass and a lot of jet stream energy. All of these things contributed to Sandy’s large size and extremely low atmospheric pressure, just to name a couple of things.

This is where, I believe, the bulk of the problems arose. In “scientific” terms, Sandy was forecast to become this “hybrid” storm, a combination between a tropical entity and a mid-latitude “nor-Easter.” This created a problem for the National Hurricane Center, who is apparently only allowed to forecast “tropical” systems. They issued a press release last Friday stating that when Sandy would transition into the hybrid storm, they would stop issuing advisories, and give that responsibility to the Hydrometeorological Prediction Center and local National Weather Service offices.

The HPC and NWS offices issued “high wind warnings” and similar advisories instead of the NHC issuing “hurricane warnings” because of the forecast transition. Because of this, last Saturday, NYC mayor Michael Bloomberg did NOT issue any mandatory evacuations for ANY parts of the city. After much scrutiny from meteorologists using social media and other forecasters such as myself, it seemed like the mayor was downplaying the real threat, and Sunday morning, he eventually issued some evacuations. However, we are becoming aware now after the storm, many people did not heed these evacuations.

Why not?

The mayor talked about the “category one” storm surge, because in fact, Sandy was “technically” a category one hurricane. That’s what our Saffir-Simpson scale qualified it as, with winds of 80-90 mph. What the Saffir-Simpson scale didn’t say though, was that the storm’s pressure was SIMILAR TO a category 4 hurricane. I stress “similar” because every storm is unique, but for argument’s sake – there’s a ballpark number.

I believe it is the same reason why the mayor was hesitant to call for the evacuations in the first place. “It’s only a category one hurricane” and “we’re only under a high wind warning, we’re under those every so often,” I believe are two common reasons for this.

This brings me to the title of this entry. Yes, “scientifically” Sandy made landfall as a hybrid system and was only a category one hurricane prior to US landfall. Unfortunately, the public doesn’t care about technical scientific terms. Let me say that again; the PUBLIC (the people we as forecasters are meant to protect) DOES NOT CARE about scientific terminology! They want to know what Mother Nature is going to do to them, their lives, and their property.

Would people have acted differently if they were under a hurricane warning instead of a high wind warning? We really won’t know. BUT what I do know is I live in Youngstown, Ohio. I was under the same NWS alerts the people in New Jersey and New York were. Read that sentence a few times to yourself. Does this make sense to you? We had rain, winds around 40 mph, with a gust to just under 70 mph about 50 miles away from us. Why were we under the same warning as people who got winds over 80 mph and had a storm surge over 10 feet?

I believe we need to have either an updated Saffir-Simpson scale that takes ALL effects of tropical cyclones into the category (Isaac was only a category 1 hurricane when it made landfall in LA this summer and had a lot of surge as well, with little precautions done). I also felt as if we should have let “technical” definitions slide with Sandy’s landfall and take our public into consideration. Would issuing a “hurricane warning” for a hybrid tropical-midlatitude system break some man-made rule or something?

I’m only a student, so I can’t really judge professionals who have been in the business for many years. However, I just wonder what MIGHT have been different if different steps were taken to warn the public about Sandy. Sandy wasn’t your “normal” coastal storm. Many factors came together that have never really been seen before (heck, it SNOWED over three feet with this storm in places).

Everything is a learning experience. Today it was made public that the NY Medical Examiner reviewed the 38 deaths in NY and found that 33 of them were due to drowning. This is absolutely awful, and in my humble opinion, preventable, ESPECIALLY since the forecasts were just about spot on!

All critiquing aside, my thoughts and prayers go out to everyone who has suffered from this tragedy. If you would like to donate to the American Red Cross, here’s how:

Text SANDY to 90999   or
Call 1-800-Red-Cross

You can follow Craig on Twitter, @ytownwx
 Tim Buckley, mentioned in this post, is found on Twitter @TimBuckleyWX
Tim also has a Facebook page http://www.facebook.com/MeteorologistTimBuckley